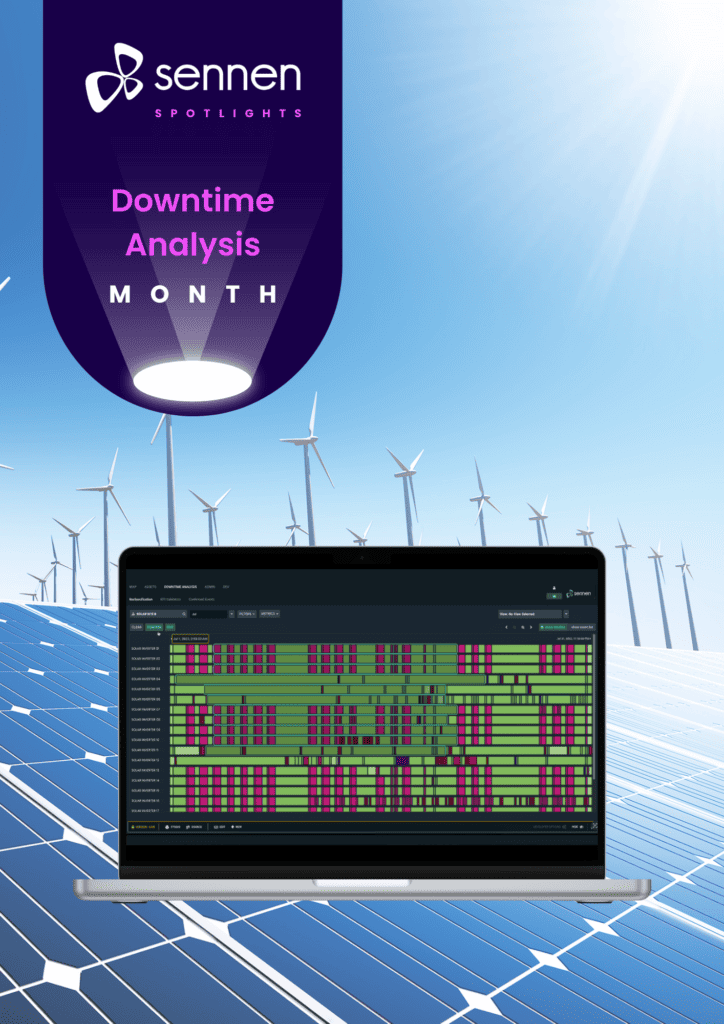
This month, for Sennen Spotlights, we take a deep dive into Downtime Analysis, offering profound insights into lost production caused by turbine and solar inverter downtime.
With Sennen, the focus shifts from conventional algorithm-centric approaches to a people-first methodology. Unlike other downtime analysis tools that heavily rely on algorithms and extensive cross-referencing across various systems, Sennen empowers operators to leverage the collective knowledge of their entire team.
COVERED THIS MONTH
Our Downtime Analysis tool has been designed for renewable energy asset managers, helping them understand and analyse energy production losses caused by site incidents and other operational losses.
It also produces clean and corrected device timelines which can form the basis of contractual availability calculations. It draws on SCADA and alarm log data so it is fully automated but it allows asset managers to delve into the data, analyse it and respond effectively.
Performing production assessments can be a complex and time-consuming exercise. With Sennen, you can gather reliable data quickly on what is causing the downtime and ultimately reduce those losses and increase revenue.
Unlike other downtime analysis tools that are solely reliant on algorithms and multi-system cross-references, Sennen leverages the power of user knowledge to enrich, refine and enhance the raw data. Operators can draw on the knowledge of the whole team to understand fully the causes of downtime rather than relying purely on SCADA data, which can be inaccurate or misleading.
All corrections that users make to device data are tracked, ensuring accountability and integrity. Furthermore, changes can be easily undone or amended as required.
All of this can be done quickly and at high volume so it’s an ideal scalable solution, and it allows you to put machine failures into the financial context of your wind or solar farm’s operation.
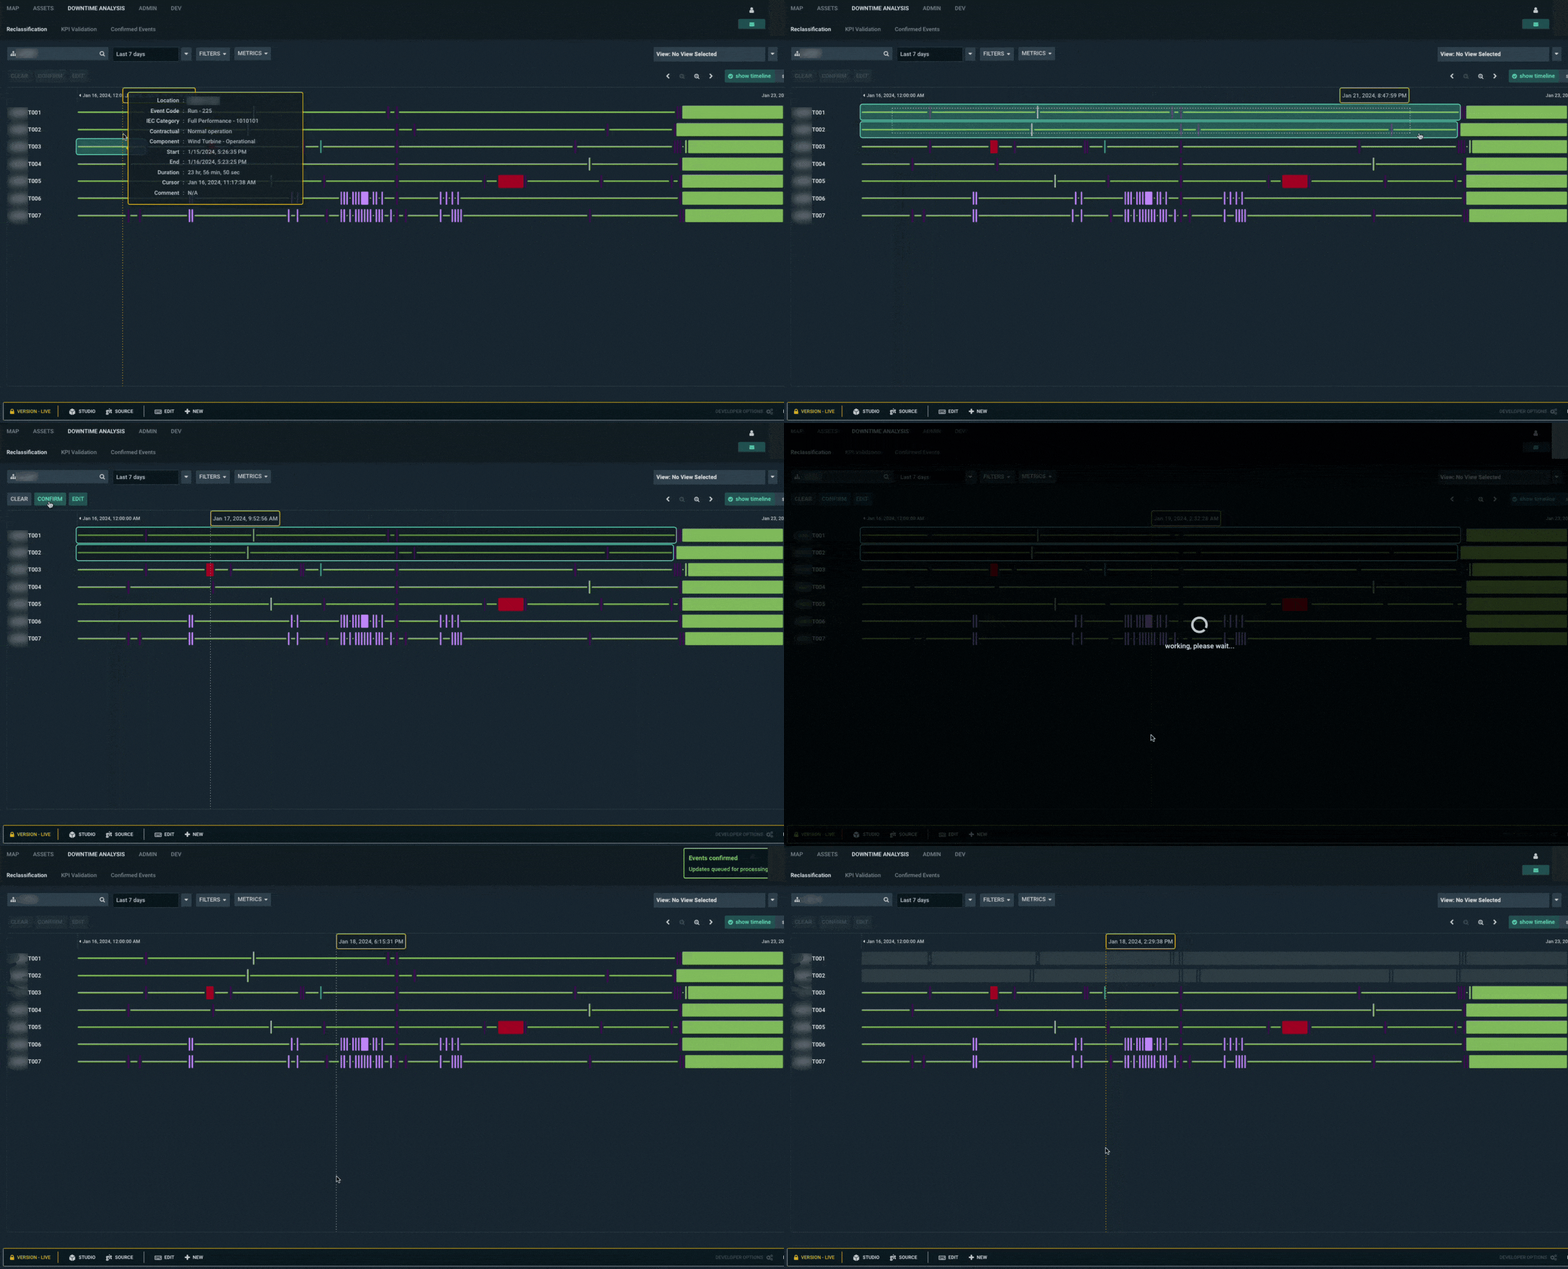
Our Downtime Analysis tool allows asset managers to analyse, prepare for and reduce downtime incidents. These include machine defects, site incidents, mains failure, component failure and maintenance shutdown. Resulting corrected device timelines can be automatically exported and used as a ‘source of truth’ for contractual KPI/availability calculations. Our user-friendly interface allows ‘event stops’ to be viewed, investigated, overridden or enriched in a few clicks.
Allowing users to switch easily between them. Different site types (such as solar and wind) can co-exist.


Simply drag and drop over multiple events and bulk reallocate with a single click.

Clear and colour-coded event categorisation makes it easy for users to analyse the data in many ways.

Flexible overview of turbine events via list or timeline.
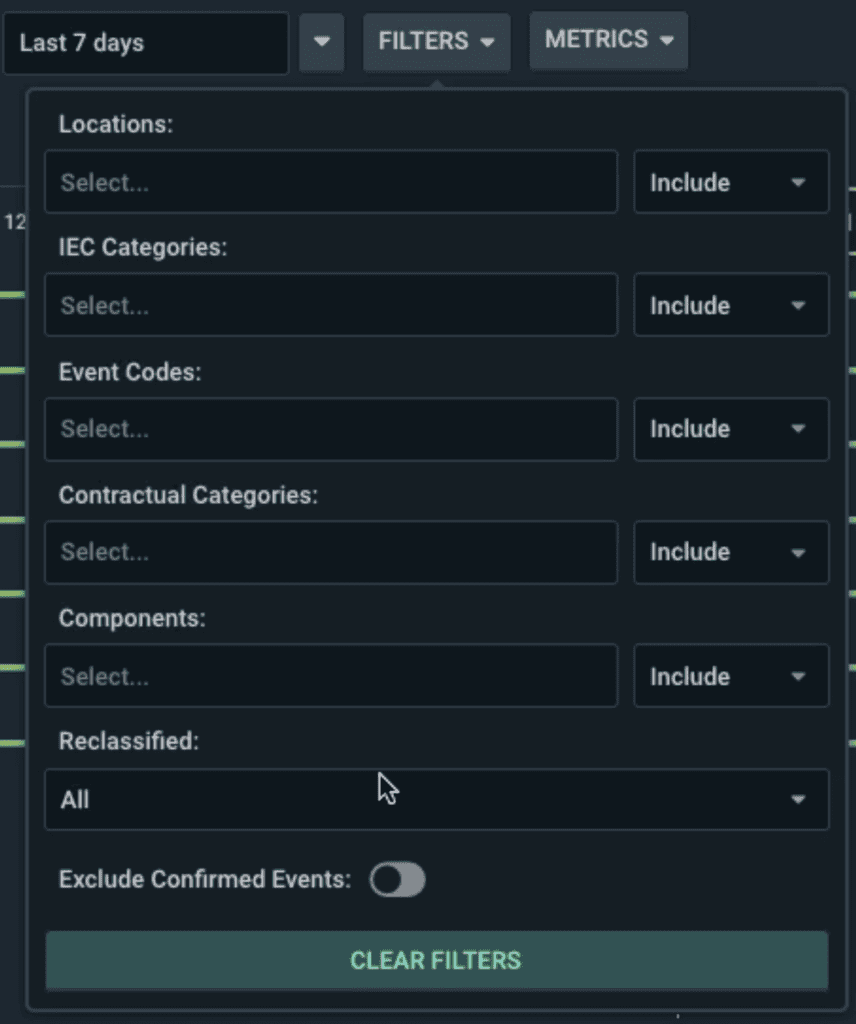
You can filter the data according to what you need to know, such as turbines, event codes, contractual categories, components. Combinations of filters can be saved, so that a user can quickly select the saved view that shows them the information they require.
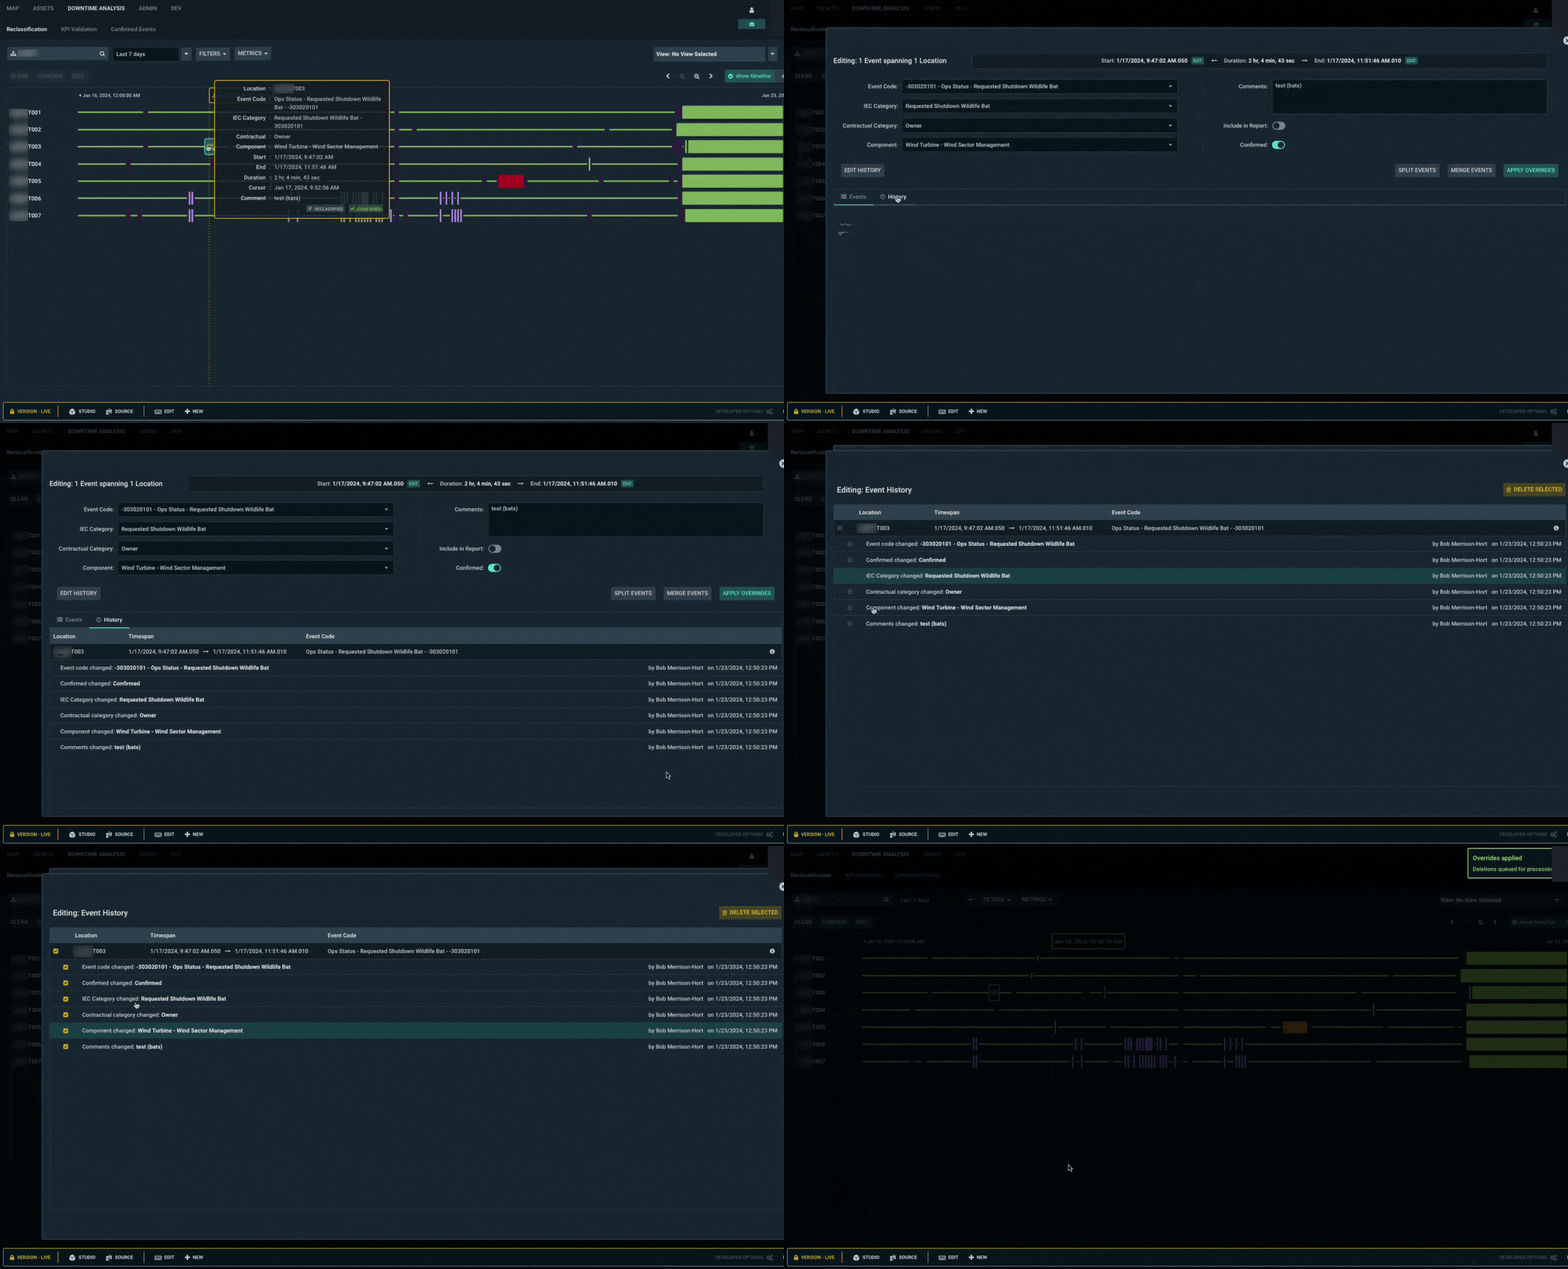
Make changes to specific fields and apply overrides.
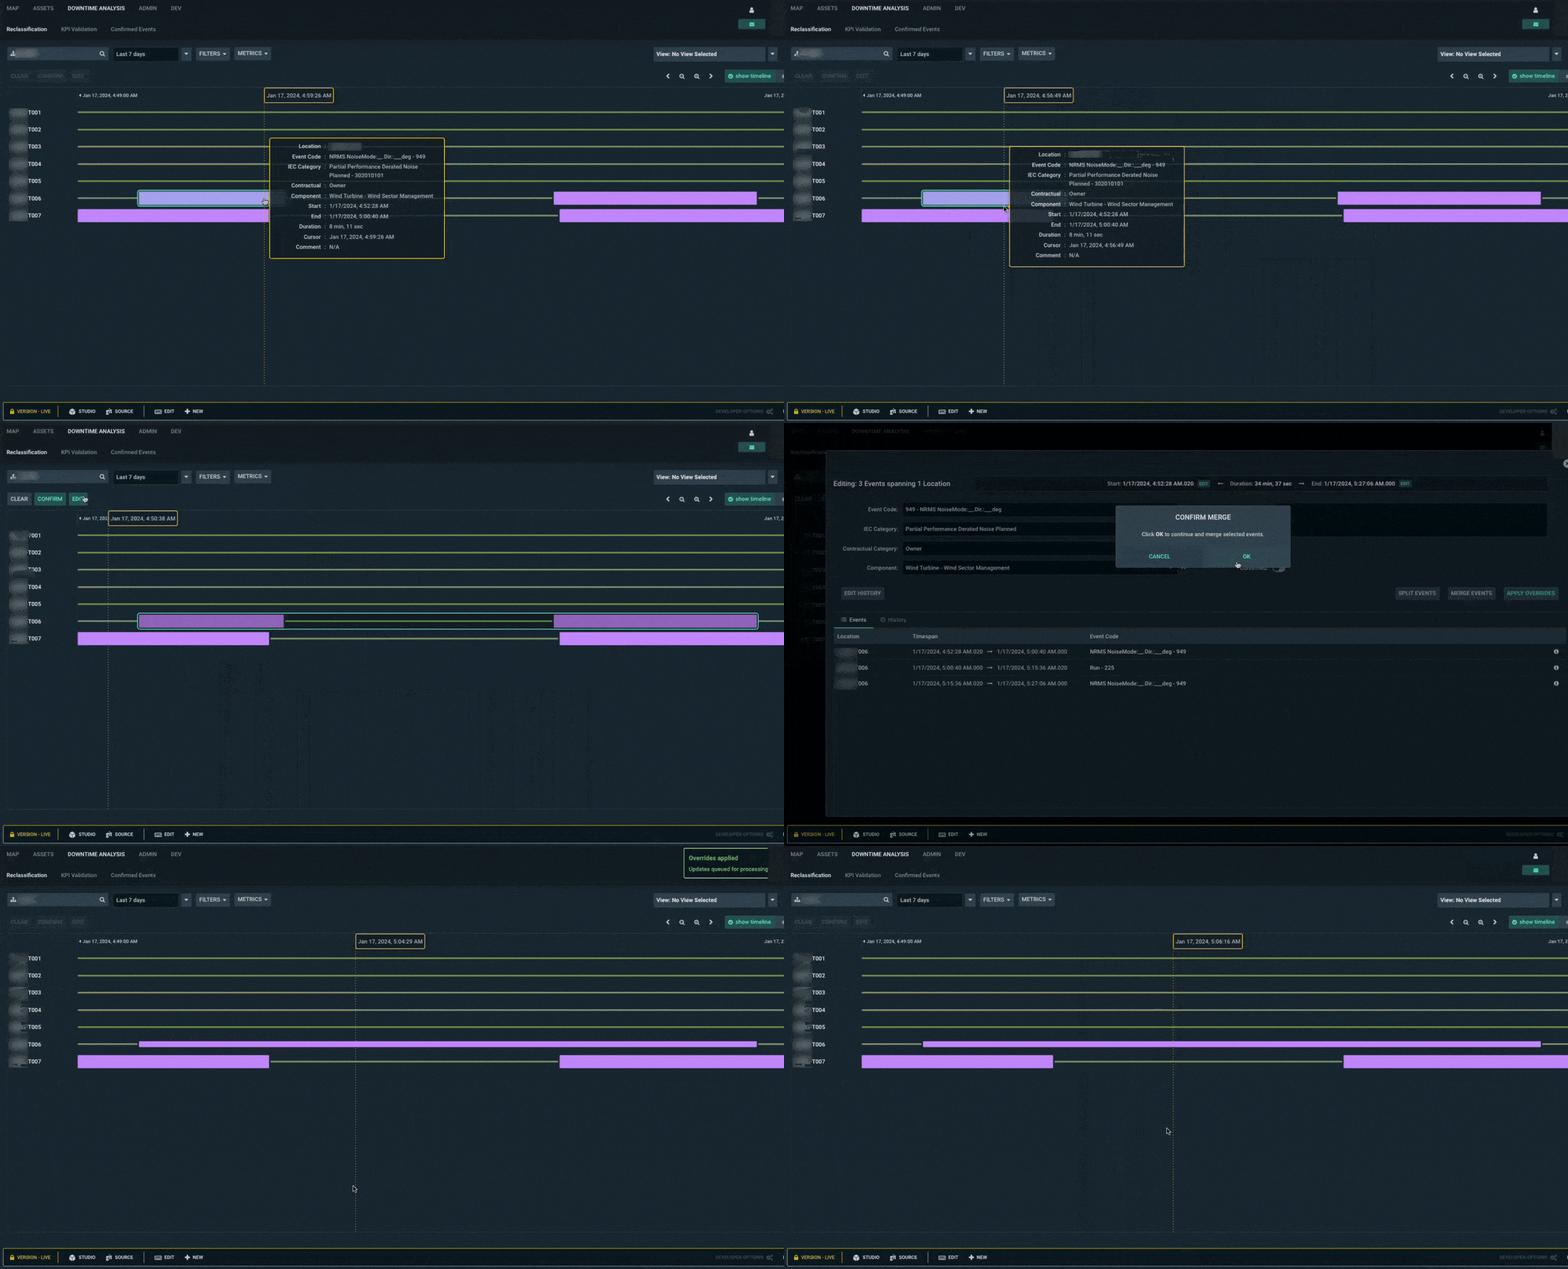
You can easily restore events to the original state.
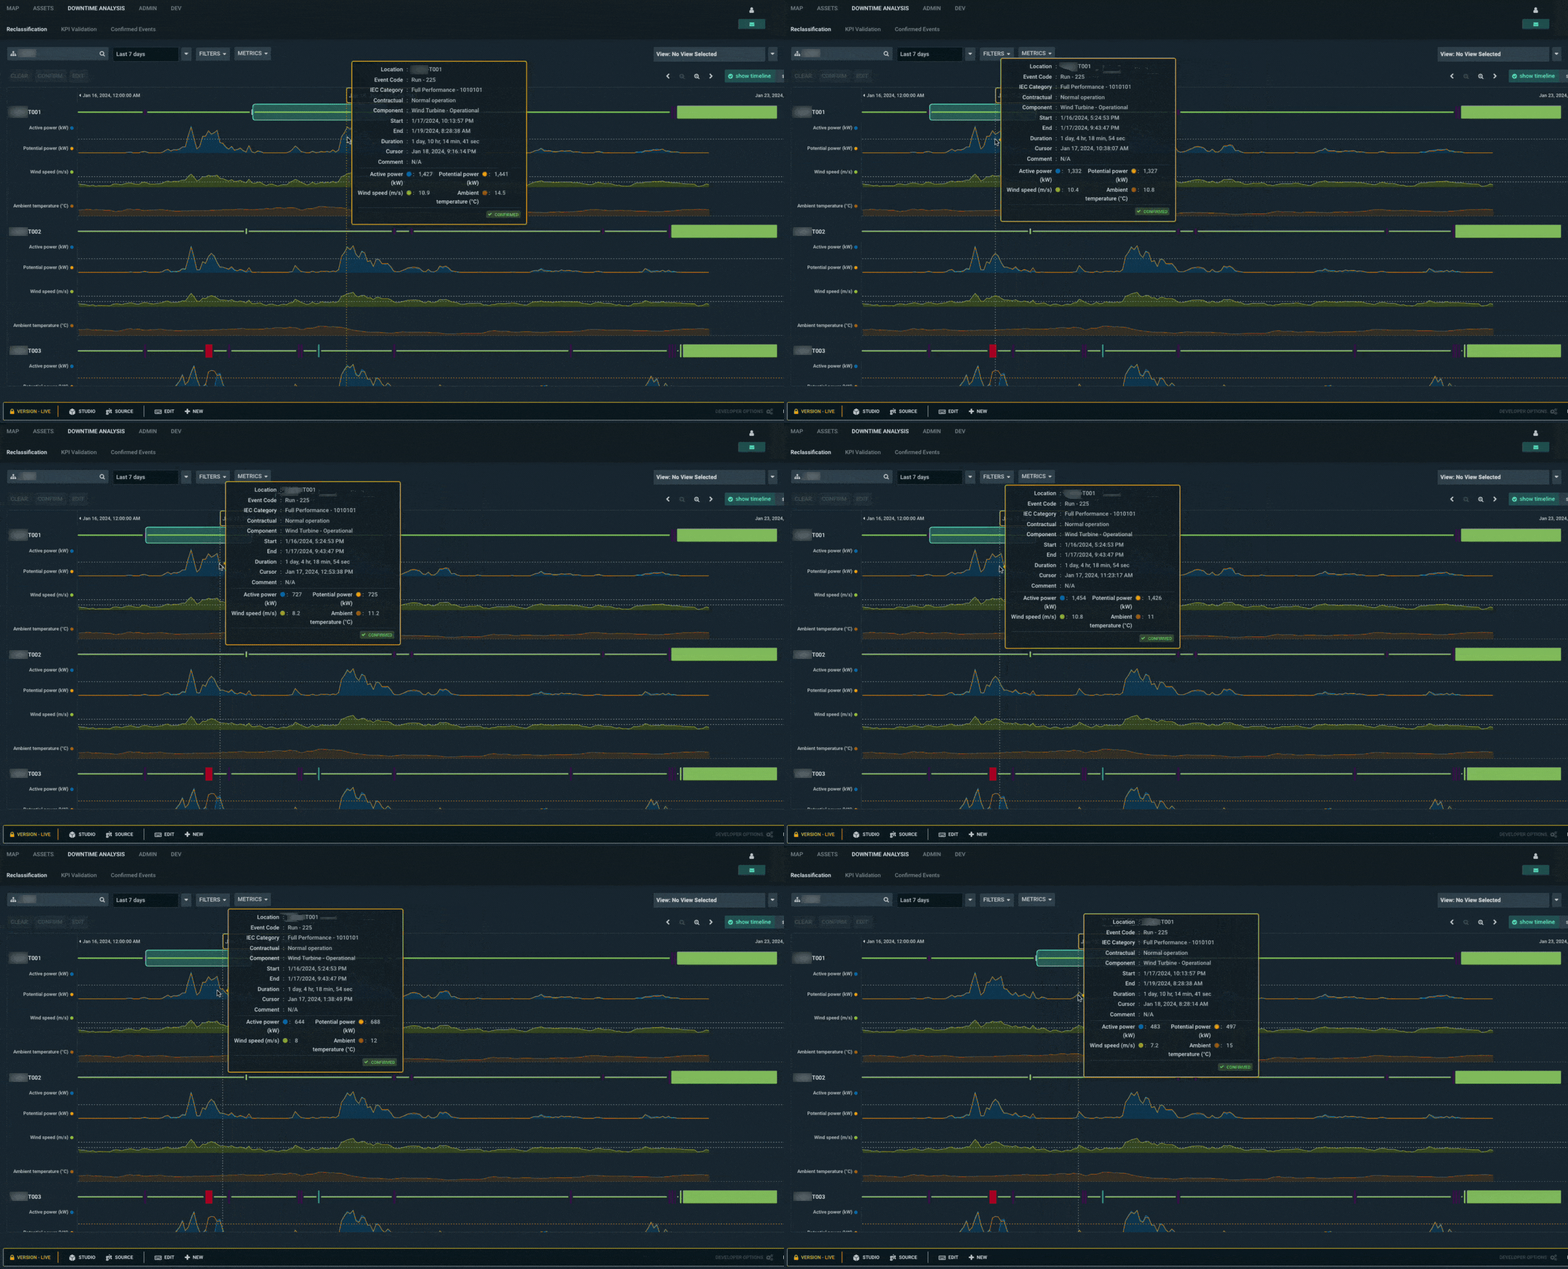
Multiple metrics (such as active and potential power, and wind speed) can be displayed alongside event timelines and will differ depending on the technology type of the site selected.
Reclassified timelines and information about user corrections can be automatically exported when changes occur. This can be offered in a range of data formats and export destinations.
Calculated KPIs can be visualised in the tool alongside device timelines and real-time metric graphs.
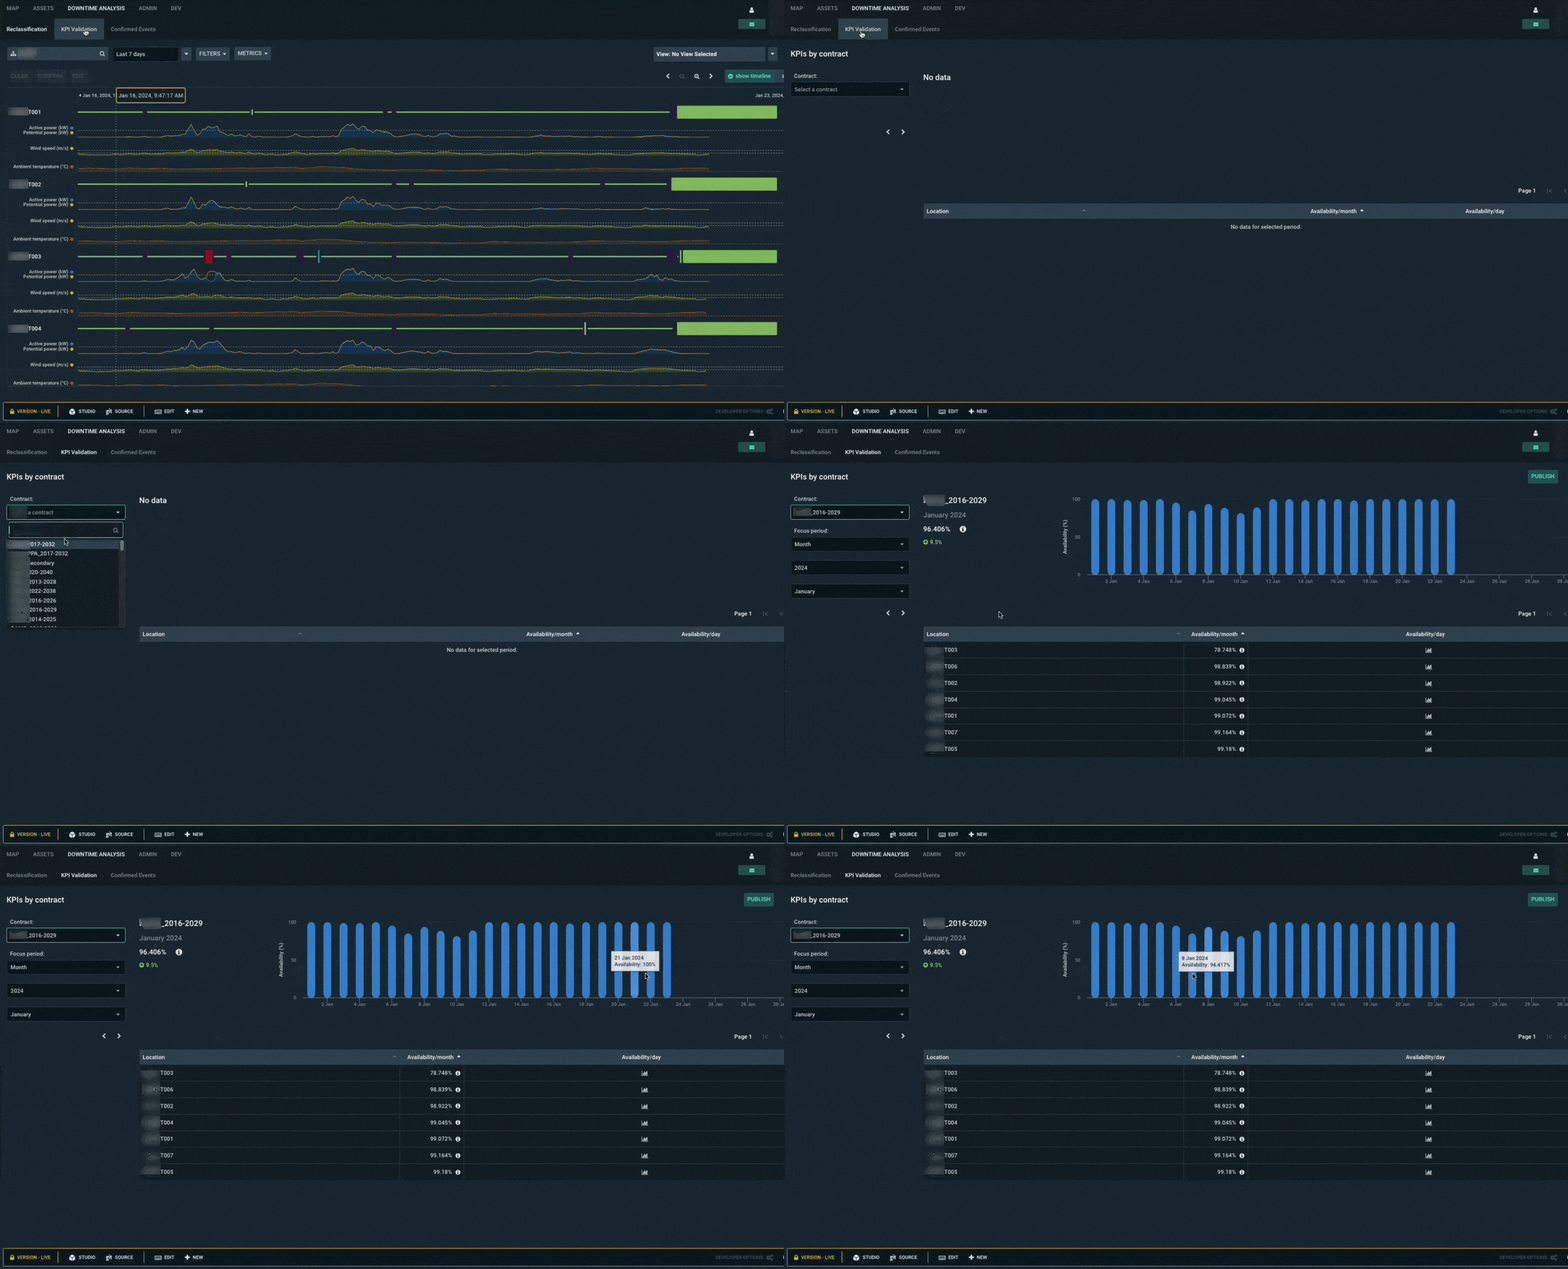
The tool can be deployed alongside Sennen’s other modules, providing combined functionality in a single set of dashboards.
Rapid and precise data analysis is fundamental to improving the performance of our wind turbine fleet, particularly as we expand our portfolio. Performing production assessments on all of our turbines is a huge challenge. In partnership with Sennen, we have a scalable system that can delve deeper into the relationships between the various causes of lost production and, ultimately, increase revenue.
Laurent Valadares, Global Head of Cloud Operations, EDF Renewables

We are experienced in integrating our tools with a diverse range of client systems. This allows us to ensure that our tools fit seamlessly into our clients’ workflows.
New deployments start with an assessment of how it will fit in with the client’s existing systems. We consider a range of questions including:
1. Where does the device alarm / event data come from? We have experience with a range of different data sources such as AWS S3 / Athena and OSISoft PI. Our integrations convert data from a diverse range of sources into a common format based on industry standards, such as IEC 61400-25.
2. How often should new data be ingested? Should this be dynamic (event driven), or scheduled periodically? The tool can operate in either mode, either responding to events almost immediately after they occur or by polling for new events regularly.
3. Should static data (such as lists of sites and turbines) be sourced automatically from a client system, or does it change infrequently enough that it can be manually configured, either by the client or by Sennen? The tool can operate in either mode.
4. Is there a requirement for reclassified timelines to be automatically exported? We offer a range of “out of the box” export formats / destinations, but are also able to develop bespoke export pipelines to suit client needs.
Once a client signs up, we start user testing, which is an essential period for identifying and addressing bugs, evaluating usability, gathering feedback on features, and validating assumptions. We ensure that the final product aligns with user expectations, functions as intended, and delivers a positive user experience.
We are responsive, involving clients in the deployment at the earliest stage and we actively encourage feedback and input into the development of the system.
We are continually expanding the functionality of the Downtime Analysis tool and this is directly driven by conversations with our clients. They are heavily involved in the prioritisation of feature development – we listen to what they need and we implement it.
Read on to discover new features in the pipeline:
1. A new ‘user event’ mode: SCADA event/alarm data is frequently unreliable, for example due to network reliability issues. This means that the raw data from devices may change over time, even once the actual event has long passed. For situations where this happens frequently it can be a challenge to maintain the association between manual user timeline reclassifications and the raw events.
To help with this problem, we are developing a “user event” mode of operation, so that user changes to events are persisted regardless of changes to the upstream raw data. It will be possible to view both the raw device timelines and the manually reclassified timelines so that changes can be seen in context. It will also be possible to define user events across multiple devices at the same time, for events such as grid outages that affect a whole site or string of devices.
2. Additional technologies: We will be expanding the tool so that it can handle a wider range of renewable technologies, such as battery storage.
3. Improved KPI calculation: Updated KPIs will be available immediately following changes to device timelines. They will also be visible alongside device timelines and real time power and environmental metrics. This will allow users to really easily see the reasons for downtime periods.
